Ratchaburi Electricity Generating Holding PCL.
21
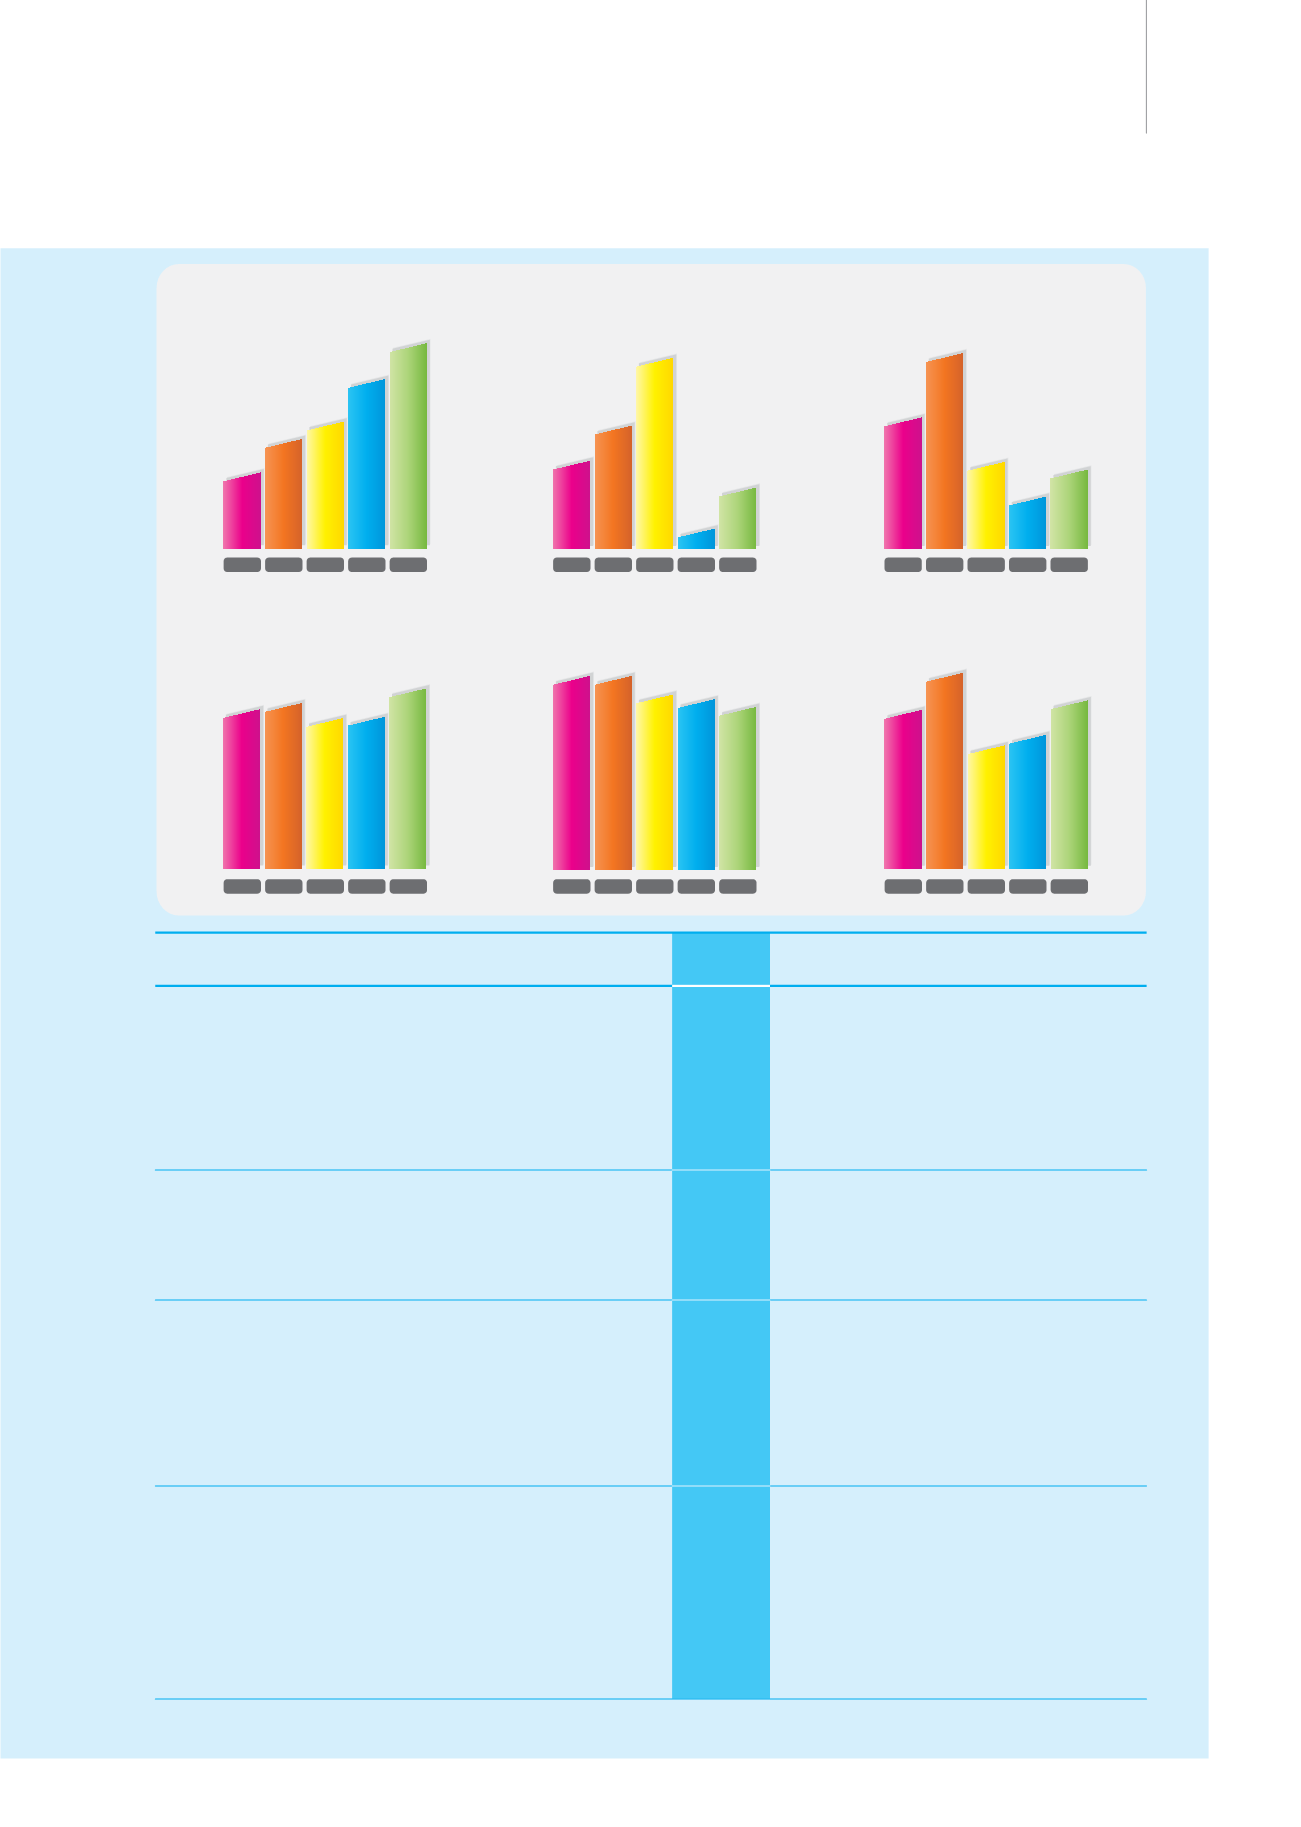
Debt to Equity Ratio (Time)
0.0
0.1
0.2
0.3
0.4
0.6
0.5
0.24
0.33
0.53
0.06
0.17
Book Value per Share (Baht)
0
5
10
15
20
25
30
35
40
37.72
36.53
33.05
32.16
30.71
Liquidity Ratio (Time)
0.0
0.5
1.0
1.5
2.0
2.5
0.91
2013 2012 2011 2010 2009
2013 2012 2011 2010 2009
2013 2012 2011 2010 2009
2013 2012 2011 2010 2009
2013 2012 2011 2010 2009
2013 2012 2011 2010 2009
1.38
1.49
1.99
2.41
Earnings per Share (Baht)
0
1
2
3
4
5
6
4.27
5.33
3.34
3.60
4.65
EBITDA (Million baht)
0
10,000
12,000
14,000
16,000
12,879
15,118
11,819
9,916
11,286
EBITDA Return on
Assets Ratio (%)
0
5
10
15
20
13.87
15.57
14.16
14.28
16.24
Year
Year
Year
Year
Year
Year
Financial Overview
2013
2012 2011 2010 2009
Profit and Loss Statement
(Million baht)
Total revenue*
53,493.79
59,213.35 45,726.07 44,187.68 37,653.83
Eearning before interest, tax,
depreciation and amortization
(EBITDA)
12,878.95
15,118.11 11,818.93 9,916.30 11,285.96
The Company’s profit
6,186.85
7,726.27 4,849.35 5,225.91 6,739.60
Statement of Financial Position
(Million baht)
Assets
88,903.25
96,810.76 97,341.84 69,581.82 69,341.82
Liabilities
33,364.39
43,079.11 48,857.36 22,905.51 24,817.69
Shareholders’ equity
55,538.86
53,731.65 48,484.48 46,676.31 44,524.13
Ordinary Share Information
Book value per share
(Baht)
37.72
36.53
33.05
32.16 30.71
Earnings per share
(Baht)
4.27
5.33
3.34
3.60
4.65
Dividend per share
(Baht)
2.27
2.27
2.25
2.25
2.25
Dividend payout
(%)
53.20
42.60
67.28
62.43 48.41
Share price at the end of accounting period
(Baht)
49.00
59.75
44.00
38.25 35.25
Financial Ratios
Liquidity ratio
(time)
0.91
1.38
1.49
1.99
2.41
Net profit ratio
(%)
11.56
13.40
10.35
11.82 17.90
Return on equity
(%)
11.49
15.32
10.26
11.47 15.77
Return on assets
(%)
6.66
8.18
5.67
7.52
9.70
EBITDA return on assets
(%)
13.87
15.57
14.16
14.28 16.24
Debt to equity ratio
(time)
0.24
0.33
0.53
0.06
0.17
* Remark: not include profit from exchange rate


